Ta Nu/iStock via Getty Images
Introduction:
The stock market has been making new all-time highs this year. There is some element of fear that stock prices are in a bubble. In fact, the AI hype has lifted some technology names to levels last seen before the dot-com crash. The legendary investor Jeremy Grantham has labeled it as a bubble within a bubble that will not end well. On the other hand, it may be too early to call the end of the bull run. If history is any guide, bull runs, and bubbles can last longer than most people think. We have seen many times before that experts like Grantham have been too early too many times in the past.
So, what is a common investor supposed to make out of it? Well, this dilemma is not new in the market, and this ongoing tug-of-war between the bulls and bears is what makes the stock market. Trying to predict what the markets are going to do next is not a viable strategy. It is actually easy and straightforward for younger folks who are several decades away from retirement; they could just invest regularly in up markets as well as down markets consistently and should do fine eventually. However, retirees and older investors who do not have the luxury of many decades should work on a consistent and diversified strategy that can work well in bull markets but at the same time is resistant to market swoons and protects investor’s capital during a market crash, at least to a large degree. We are going to discuss one such strategy, and we also refer to such a strategy as the SWAN (Sleep Well At Night) strategy.
What is Hedging, and Why Do You Need One?
Well, every individual’s needs and circumstances are unique, and one solution does not work for everyone. So, one should carefully consider and select what strategy would work best for them.
That said, why do we need hedging, or do we need it at all? Again, it depends on your stage of life and your personal temperament around investing. If you are young (especially under 45), you may not need hedging as long as you are capable of ignoring the market corrections. But, some form of hedging may be important if you are older and cannot tolerate deep draw-downs in your portfolio. Very deep draw-downs can cause emotional stress in most investors, and many of them often make irrational decisions at times, especially when they need to do nothing.
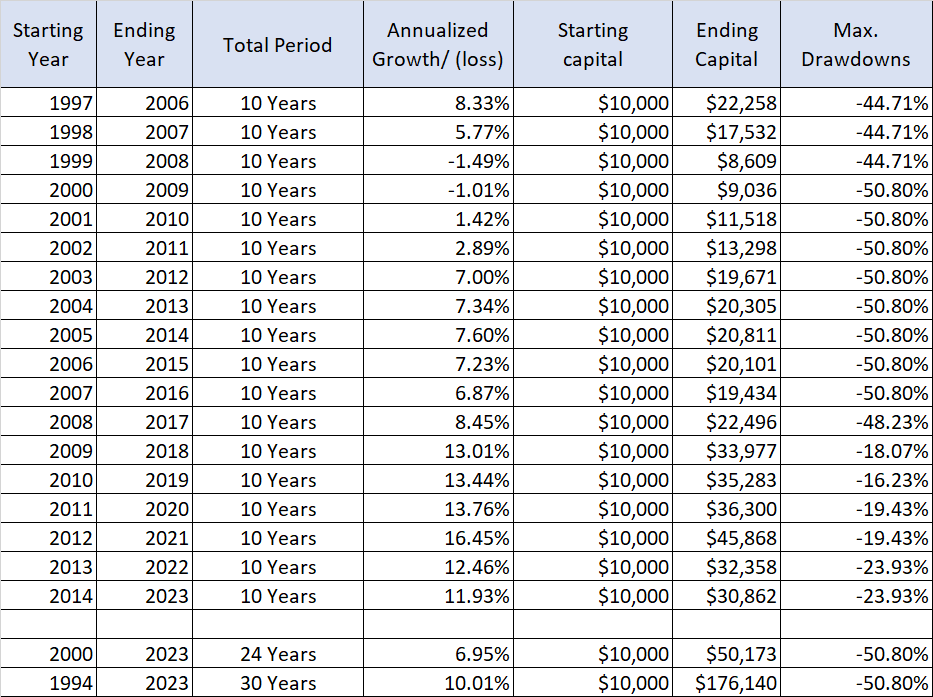
Fortunately, in the U.S., we haven’t had a very deep correction like the one in 2008-2009 in quite some time (except for a short COVID-induced correction). Even more painful was the 2000-2002 correction, as it was a rather long-drawn-out process for almost three years. But it can certainly happen in the future. The S&P 500 (SP500) has performed very well since 2010, in fact, beating most strategies. No one can say for sure if the next ten years will be like the last decade or the lost decade of 2000-2009. Below, we present the 10-year rolling returns for every year since 1997.
Table-1: 10-Year Rolling Returns from the S&P500, since 1997
It is clear from the above table that for retirees or near-term retirees, it is critical to avoid the “Sequence-of-Returns” risk (defined as the risk of large negative returns occurring in the initial few years of your retirement or just a few years before your retirement). This is where some sort of hedging (at least on a portion of your portfolio) becomes helpful.
However, most hedging mechanisms are costly and may eat into your returns, so they should be avoided. However, we usually recommend allocating a portion of your portfolio to a rotational strategy that has an in-built hedging mechanism without any fees. These strategies do not have to be low growth, either. In fact, if chosen carefully, they can provide high growth, and some of them can provide good income as well. We will discuss one such strategy in the next section.
What is our SWAN Portfolio Strategy?
This swan strategy is very similar to our NPP (Near Perfect Portfolio) strategy, except that allocations and formations of various buckets are a bit different. The SWAN strategy has three buckets (or sub-portfolios), each with a 1/3rd (33%) allocation. However, you can always alter the allocations to some extent to match your individualized goals and needs. Here are the goals of the strategy:
- To achieve a high level of asset diversification and to provide an in-built hedging mechanism to lower the volatility and minimize the draw-downs (roughly 30%-40% less than that of the S&P 500).
- Grow the capital (including the dividends) to at least match or exceed the performance of the S&P500 over 10–15 years.
- Earn (ability to withdraw) 5% to 6% of income on an annual basis.
Lower draw-downs and volatility will help retirees avoid “Sequence of Returns” risk and keep them in the game in the good times and bad. We know that most investors, especially retirees who do not have a regular income, tend to panic when the markets correct in a big way. To avoid making bad decisions in an emotionally stressful situation, we need a portfolio that tends to preserve the capital while generating substantial income.
Three Buckets of the SWAN Strategy
I. DGI – Dividend Growth Investing:
We believe every investor who has some interest and time to devote to their investments should have a DGI bucket. If you have interest and time, you can certainly gain the knowledge. After ETFs, DGI is the simplest form of investing. You can start with just five stocks and grow to 10 or 15 over time. Also, with DGI, you do not have to find the next Amazon (AMZN) or Apple (AAPL) every time. You simply go with the established large-cap companies that have grown their dividends consistently for more than ten years (if not more). Simply find stocks that have the sum of dividend yield and past 10-year dividend growth of at least 10 (the higher, the better, but we can lower it for utility-like stocks if a higher yield is required). Sometimes, folks refer to this number as the “Chowder” number as well, but the Chowder number takes the past five years of dividend growth; we prefer to take the average of 5-year and 10-year growth into consideration. It is also recommended to have a blend of high-growth-low-yield and high-yield-lower-growth stocks.
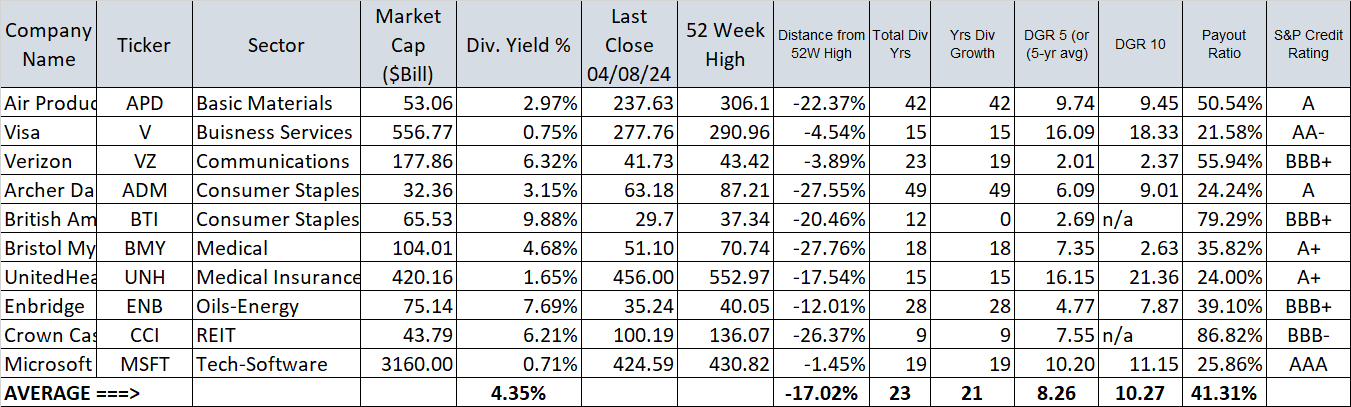
In this article, we will assume our investor is 50 years old, and we will select ten stocks that would vary from low yield (high growth) to high yield (low growth).
Note: This list should not be treated as a “buy” recommendation as we have not analyzed their current valuation. Some of them may be expensive in the current market scenario. However, in such situations, it is best to accumulate using the principles of dollar-cost-average.
Stocks Included: (APD), (V), (VZ), (ADM), (BTI), (BMY), (UNH), (ENB), (CCI), and (MSFT).
Table-2: DGI-Bucket Portfolio (sorted by sector):
II. High-Income Bucket (FUND/ETF Bucket):
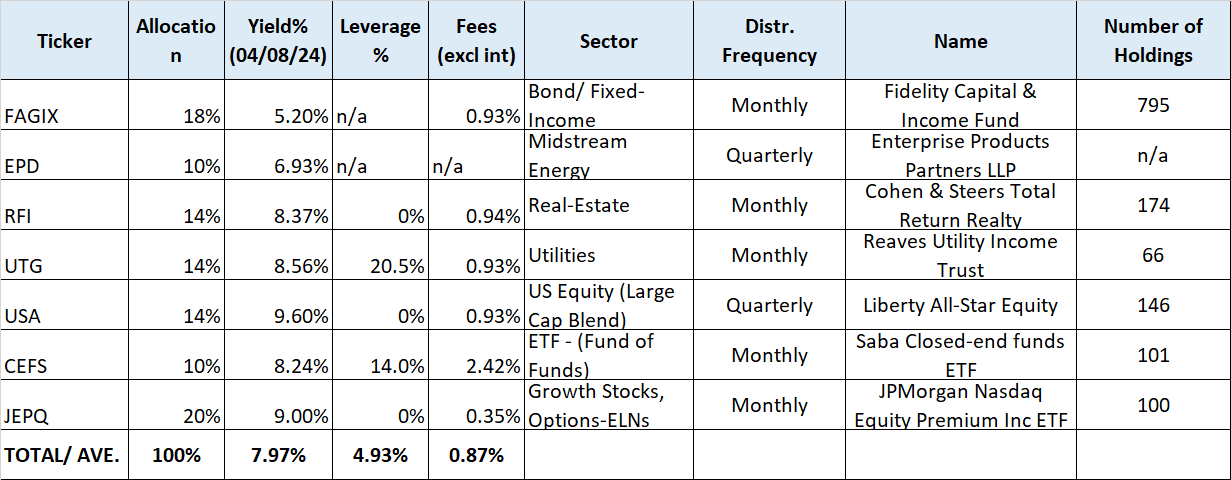
This bucket will focus on 7–10 funds that will not only provide a very high level of diversification but also provide a high level of income. We will target an 8% income from this bucket, but depending upon the market, you may have to start initially at 7% and bring it to 8% by re-investing the dividends for some time. Depending upon your need for income and growth, you can change the allocations to various components in the bucket. Let’s say you need higher growth and less income; you may replace JEPQ with QQQ.
In a way, this bucket will be self-sufficient on its own, and that’s why we will allocate it the same weightage as the DGI portfolio.
Funds Included: (FAGIX), (EPD), (RFI), (UTG), (USA), (CEFS), (JEPQ).
Table-3: High-Income Fund-based Bucket:
Note: In the above table, we have 6 Funds/ETFs and one individual company that is a partnership MLP. This company issues a K-1 (partnership income) instead of a usual 1099-Div at tax time.
III. Hedging Bucket (Rotational bucket):
Remember, we started with the goal of having a SWAN (Sleep Well At Night) type of portfolio. We want to have peace of mind while our investment portfolio is working to provide us with high income and decent growth, right? The purpose of this bucket is to provide some level of hedging to the overall portfolio without skimping on growth. This bucket will limit the draw-downs to a tolerable level, for example, a max of -20% when the broader market is down -50%. We also call this bucket a “Rotational” bucket.
The variations and possibilities for this bucket could be endless. However, we provide three rotational models in our Marketplace service. For this article, we will provide one such Rotational bucket.
High-Income Asset-Rotational Bucket:
The idea is to have securities that represent asset classes that tend to move differently under varying market conditions. So, we will have securities representing Equities, Treasuries, Gold, and Cash (could be money-market). Sure, there will be times when all of them (except cash) will move in unison, but that does not happen often or long enough. However, please keep in mind that we will not own all of them at one time, but just the two best-performing assets (in different proportions).
List of four securities:
- Invesco QQQ Trust ETF (QQQ)
- iShares 20+ Year Treasury Bond ETF (TLT)
- SPDR Gold Shares ETF (GLD)
- Cash (in the form of money market fund).
OPTIONAL
- Vanguard Materials ETF (VAW).
Note: An example of a money market fund would be Fidelity Govt. Money Market Fund (SPAXX). This will ensure that our cash earns some interest payments whenever it is left in the money-market fund.
So, we will compare the total performance (return) of the four securities (over the past three months) and invest 2/3rd in the top-performing and 1/3rd in the 2nd best-performing security for a month. Every month, we will rotate them on this basis; that’s why it is called the Rotational model.
You may have noticed we have indicated a fifth security VAW that is optional. VAW is a highly diversified materials ETF that holds commodities like aluminum, copper, industrial gases, gold, silver, steel, fertilizers, diversified metals, etc. If we add this to our basket of securities, it will probably add to the performance but will also lead to a bit higher volatility. VAW, being a commodity and materials ETF, can often diverge from the S&P500.
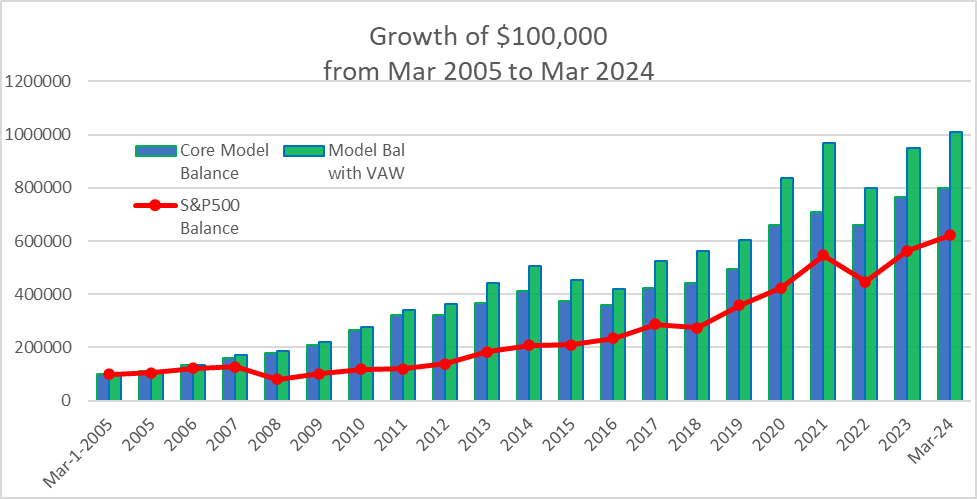
Back tested performance of the Rotational Bucket:
With the assets and the ETFs that we selected, we can perform back testing by going back as much as Mar. 2005. So, the back test covers just over 19 years, from Mar. 2005 to Mar. 2024. It returned roughly 1.40% points higher in annualized returns over the S&P500, on an average over 19 years. However, more importantly, the volatility was lower by 25% in comparison to S&P500. It also resulted in 75% less drawdown (-18.5% for the model versus -51% from the S&P500). Now, this big difference in draw-downs happened during the 2008-2009 crisis, which provides a level of confidence that the model should preserve capital during big corrections.
Chart-1:
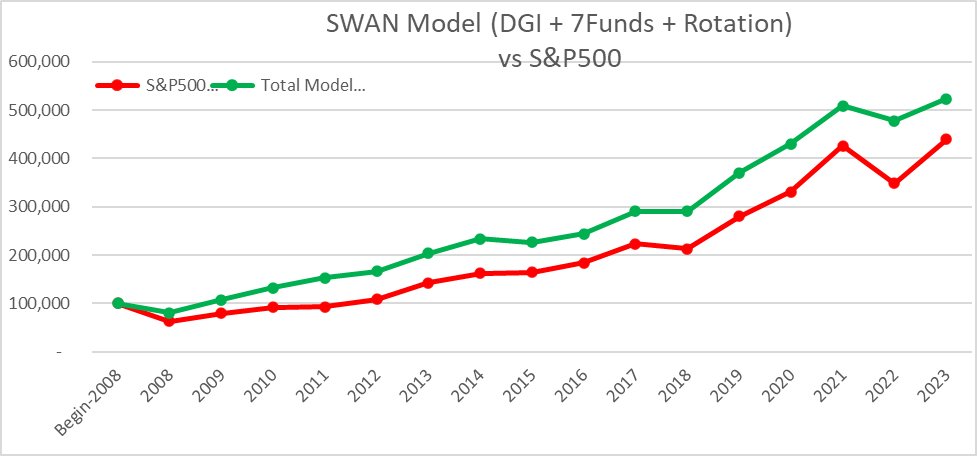
The Combined SWAN Portfolio:
Here are some back testing results for the combined portfolio from the beginning of 2008 until 2023:
Note: To test the DGI, we replaced Visa with Mastercard (MA) for the partial period. We had to make some adjustments to be able to back test the second bucket (7 funds). We had to remove the CEFS fund and evenly distribute its share to the rest of the six funds. Furthermore, we also had to replace the allocation of JEPQ with QQQ and ETY.
Table-4:
|
Performance (from Jan. 2008 – Dec. 2023) |
3-Bucket SWAN Portfolio** |
S&P500 |
|
Annualized Return [CAGR] |
10.90% |
9.69% |
|
Growth of $100,000 |
$522,833 |
$439,063 |
|
Max. Drawdown |
-25.5% |
-48.5% |
|
Std. Deviation |
14.17% |
16.18% |
|
Market Correlation |
0.69 |
1.00 |
**The allocation ratio for various buckets was taken as 34% DGI, 33% Rotational, and 33% 7-Funds bucket.
Concluding Thoughts
No investment strategy can be perfect or risk-free. The strategy described above revolves around three distinct buckets to provide diversification, capital preservation (hedging bucket), and market-matching or market-beating growth. Moreover, it would allow its owners to safely withdraw income to the extent of 5-6% without the risk of capital depletion.
We believe this portfolio will not only exceed the performance of the S&P 500 over the long term but also provide a reliable income stream and have less volatility and draw-downs, making it a SWAN-like portfolio.